A Flexible and Powerful Monitoring and Data Analytics Platform.
Fully Free with all Features included!

The Free Solution to Data Problems
The Engineered Monitoring Platform, short EMP, is a project that arised to address the need of having an easy to customize Monitoring, Data Analytics and Dashboarding solution. Company and team-specific data visualization can be created on the fly, without the necessity to rely on custom implementations by 3rd party vendors. The best value you get from EMP is its very flexible yet easy to use query language, which enables you to solve problems that other multi-million dollar tools are unable to tackle without considerable efforts.
- Powerful, Open-Source and Extensible Platform
- Display data from Databases, Web APIs and other sources
- Visualize your data in a single location


Mike Nemecek
Performance Manager
EMP has been an absolute game-changer for extracting data from Dynatrace and seamlessly integrating it into Power BI. The export process is incredibly straightforward, and customizing the data to fit my specific needs was surprisingly easy. Thanks to EMP, I was able to streamline my workflow and focus on gaining valuable insights without any hassle. Highly recommended!.

Reto Scheiwiller
Senior Performance Engineer
The platform enables me to fetch data from Web APIs and Databases to create dashboards and data analytics views in a matter of hours, rather than spending weeks to develop an application from scratch. It saves me a lot of time - and my customers a lot of money!

Frank Grümmert
Lead Application Monitoring and Non-Functional Test PP
As a customer, I’m highly satisfied with EMP as a monitoring and observability solution. Its standout feature is the remarkably fast integration into existing environments and the ease of connecting diverse data sources, enabling internal users to get started quickly without steep learning curves. At the same time, EMP offers the depth to build complex visualizations through targeted queries across multiple systems, supporting a truly holistic view. Compared to established players like Grafana, EMP stands out for its responsiveness, openness to feedback, and rapid adaptability. Moreover, EMP is capable of integrating data from other solutions such as Dynatrace, Grafana Mimir or Prometheus providing a unified perspective across platforms.

Josef Mayrhofer
Founder and CEO of Performetriks
Correlating data from multiple sources is crucial for the success of our performance engineering projects. Instead of re-inventing the wheel, we use EMP to easily extract data from a variety of sources and visualize it in powerful Dashboards.

Manuel Pacheco
Senior System Engineer
I love how it effortlessly brings together data from diverse sources and lets me tailor the visuals exactly how I want. The platform doesn’t force one way of looking at things, instead, it gives you the freedom to design dashboards that meet your exact needs. Because of that flexibility, I can focus on insights instead of fighting with tools.

User Management
Fully integrated user management without the need to buy a commercial version
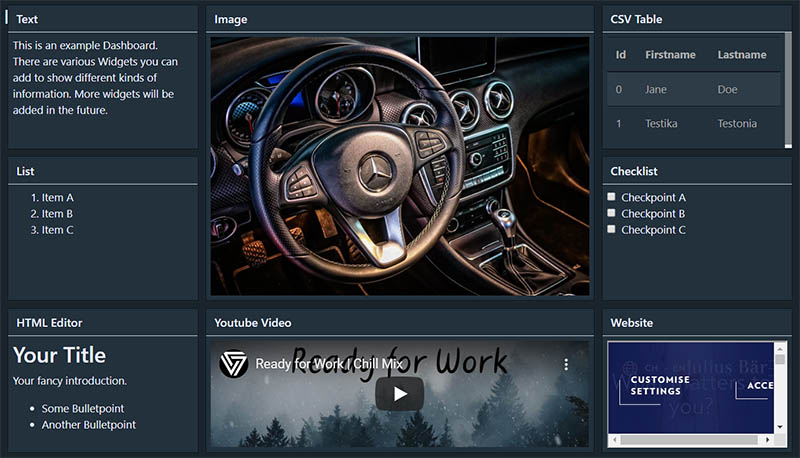
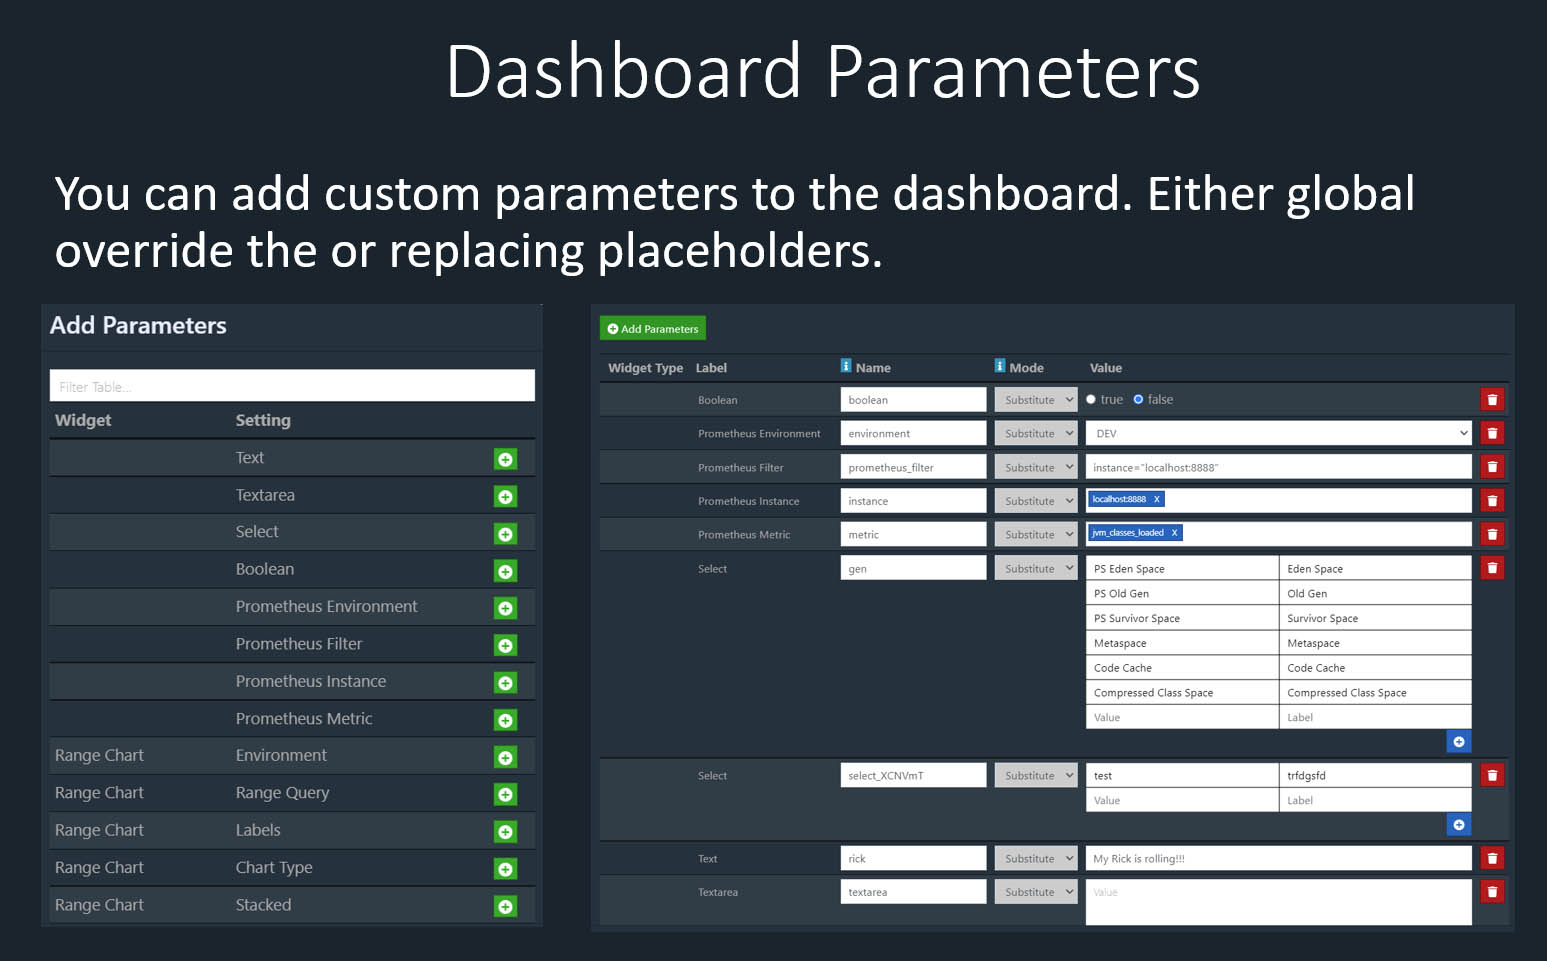
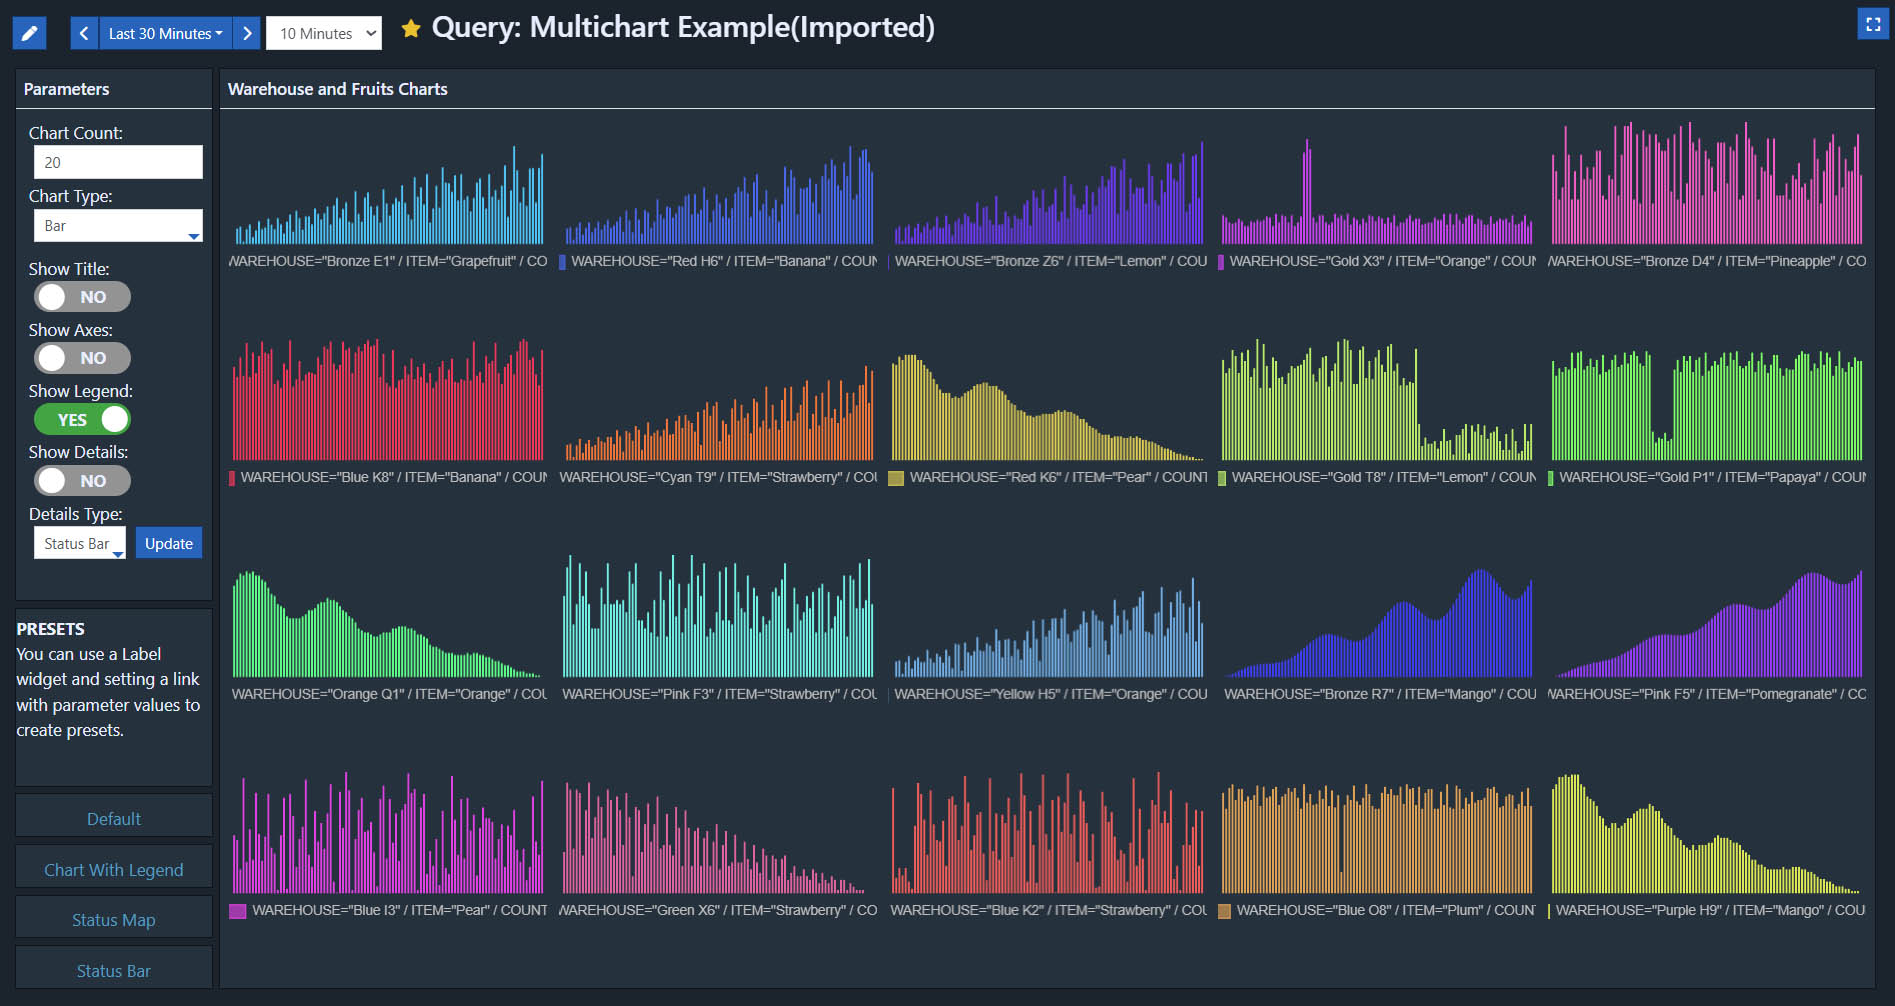
Dashboarding
Powerful dashboarding capabilities that allow you to create customized views to fit your specific use cases.
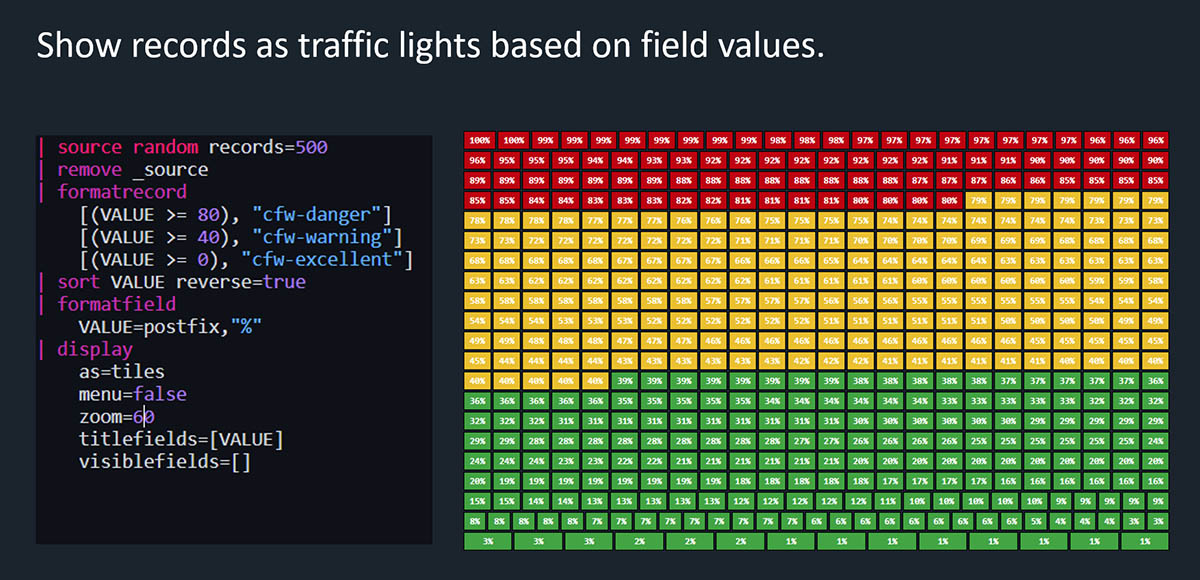
Query
Query, manipulate and visualize your data as you need it.
Report and Export
Get scheduled reports or export data directly from a dashboard.
Use Cases
Where EMP solves Your Problems
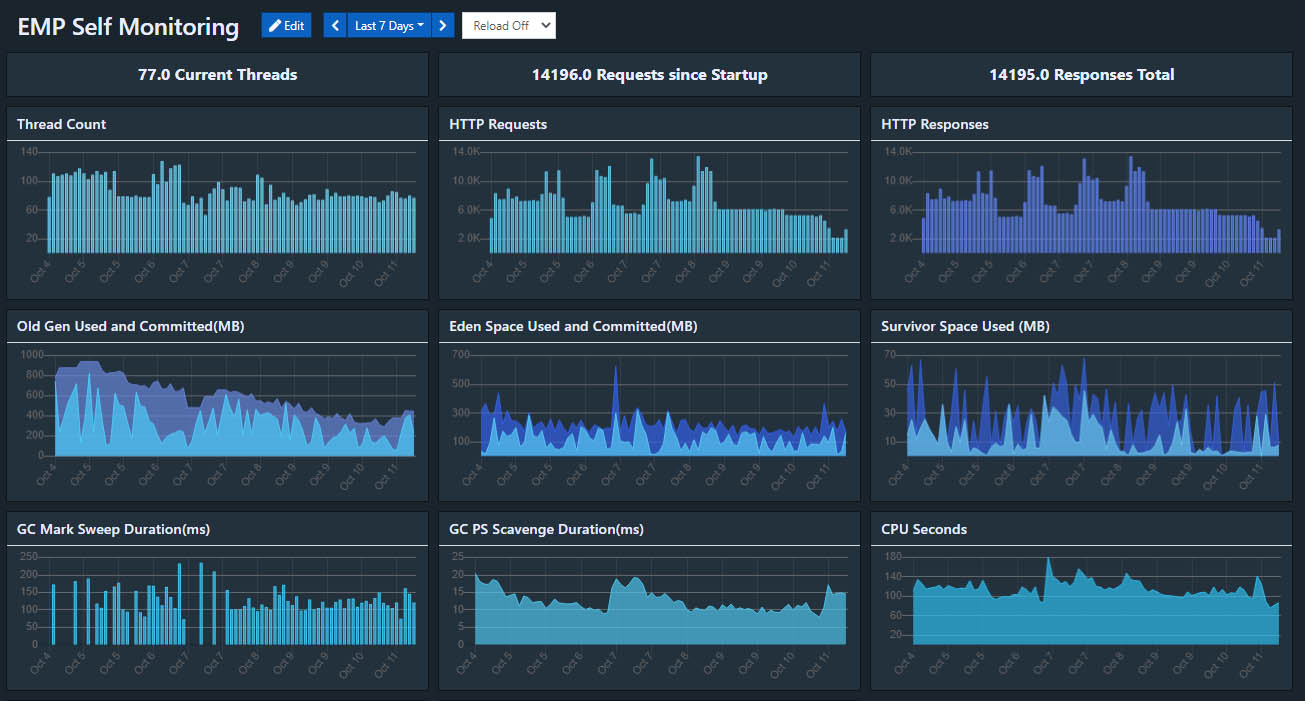
Monitoring
EMP is a fully featured monitoring solution that helps you to increase the observability of your systems.
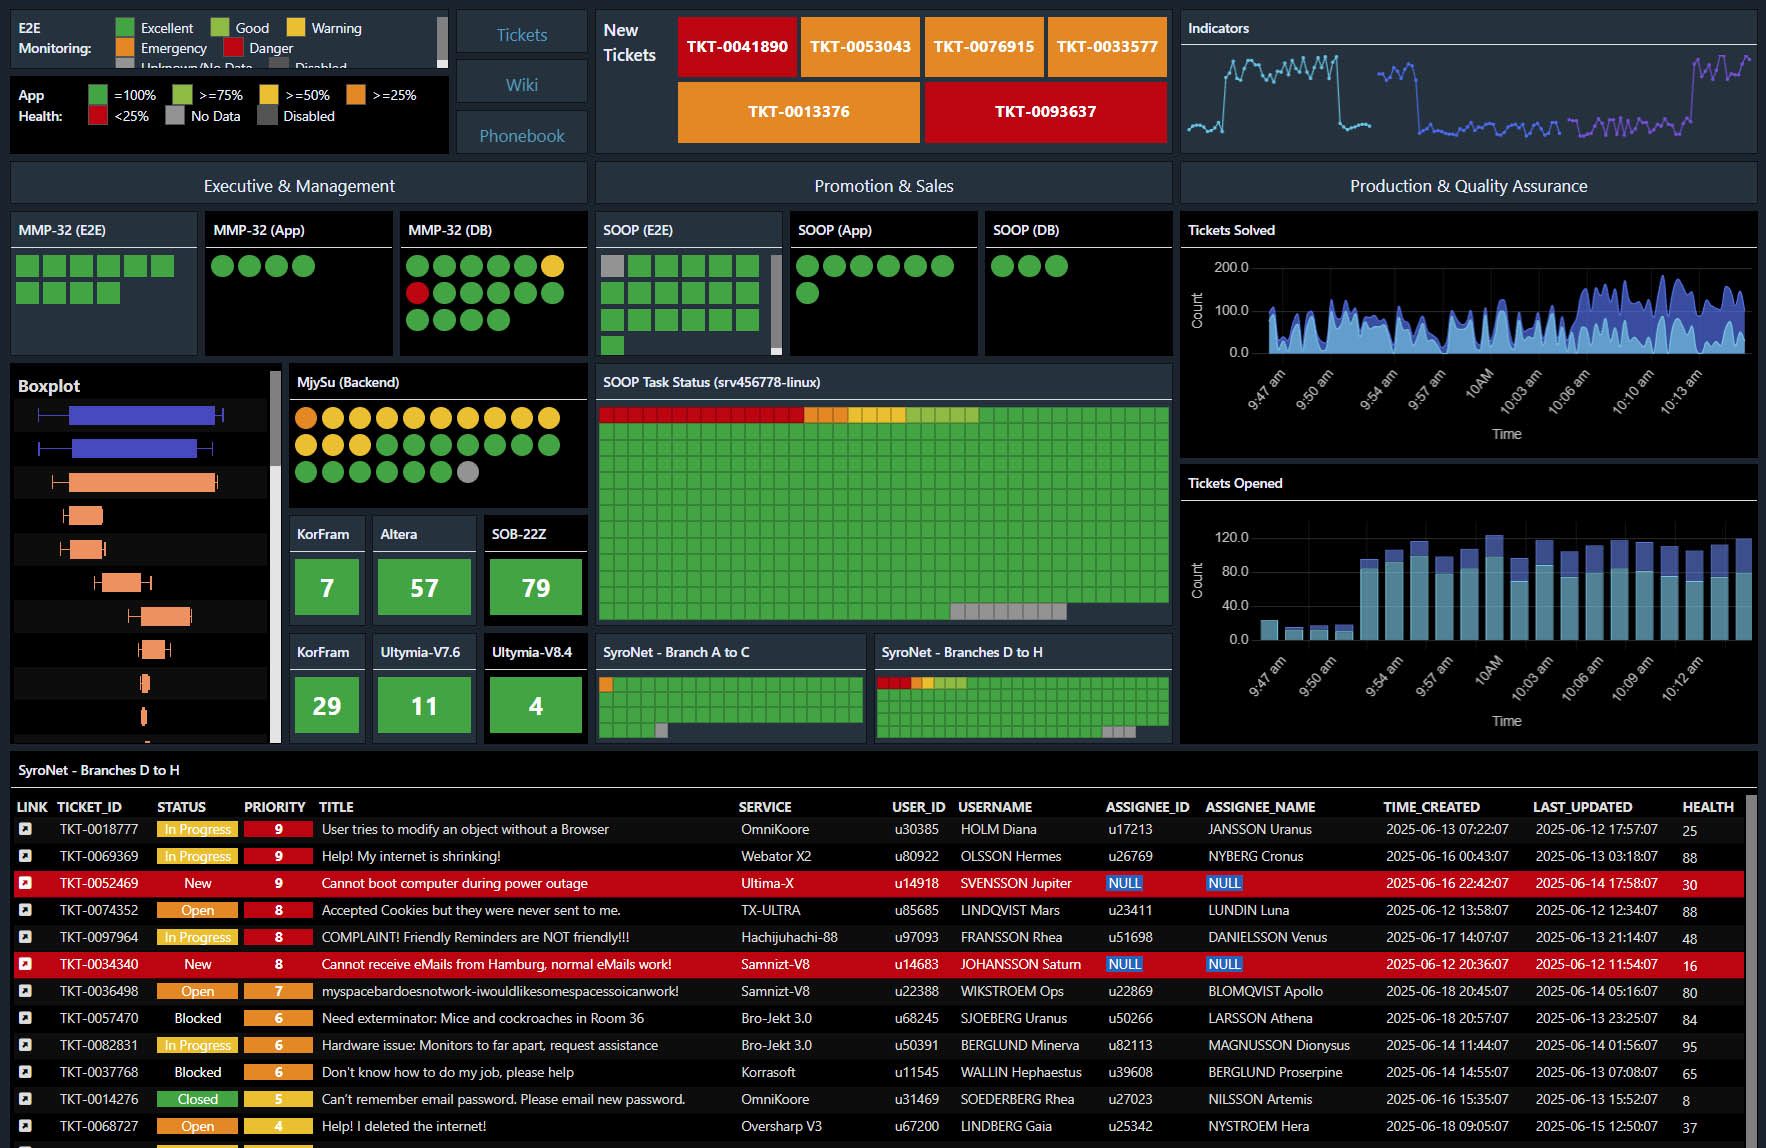
Dashboarding
With dashboards you can create exactly the views that help you the most, tailored to every aspect of your needs.
Data Exports
Create an easy interface to export your data for using it in other tools like Excel of PowerBi.

GET IT NOW!
Don't wait any longer and go download your free copy of the Engineered Monitoring Platform from the official repository.
Visit GitHub!Screenshots
See How it Looks